Tuesday, October 31, 2006
October Results
Up 0.4 percent today. For the month of October, the portfolio gained $36,235 (4.8 percent), the best monthly performance since April. However, despite this solid result, I did underperform the Russell 2000 by 0.9 percent in October. Interestingly, despite the constant chatter that investors are finally shifting money away from smallcaps and into large caps, the Russell 2000 has outperformed the S&P 500 since the market bottomed in August. I guess smallcaps still have some room to run, although inevitably I know the party will eventually end.
Monday, October 30, 2006
Meander
My portfolio meandered out the gate this morning, looked around, ate some hay, and then took a nap: up less than 0.1 percent for the day. Yes, microcaps are volatile. But most of that volatility is idiosyncratic. So if you have a well diversified portfolio (in my case, no stock is currently greater than 4 percent of the portfolio), you're not really taking on any more risk than someone who owns the Dow 30.
Friday, October 27, 2006
Weekly Summary: Screening for fun and profit
My portfolio would have stayed in the plus column today were it not for PTG getting hit over the head with a two by four and losing more than 10 percent of its value. Still, I ended the week with a profit: up $4,824 (0.6 percent), more or less in line with the overall market (p.s. when I say "profit", all I really mean is the change in my portfolio, not a realized capital gain).
Quite a few readers have asked me what I look for when I run stock screens. Here are the most important variables that I look at (in no particular order):
Price to sales
Gross profit margin
Price to earnings
Price to operating cash flow
Price to book
Past revenue growth
Past earnings growth
Price to enterprise value
PEG ratio
Debt to equity
Net insider buying
Consensus analyst recommendation
One thing I would really like to screen for is "current price relative to average analyst price target". One of the things that attracted me to TSYS and SPPI, for instance, was that the consensus analyst price target for these stocks was much higher than the price at which I bought them. If anyone knows an online screener that screens for that particular criteria, please let me know and I shall be very grateful :)
Quite a few readers have asked me what I look for when I run stock screens. Here are the most important variables that I look at (in no particular order):
One thing I would really like to screen for is "current price relative to average analyst price target". One of the things that attracted me to TSYS and SPPI, for instance, was that the consensus analyst price target for these stocks was much higher than the price at which I bought them. If anyone knows an online screener that screens for that particular criteria, please let me know and I shall be very grateful :)
Thursday, October 26, 2006
Giddy up Bronco!
Up 0.6 percent today. I bought 600 shares of Bronco Drilling today. The stock trades at 5 times 2007 earnings and is projected to grow at 25 percent over the next five years. Cheap enough for me.
Wednesday, October 25, 2006
Missed an easy lay-up on ACSEF
Up 0.2 percent yesterday and up another 0.2 percent today. Because I work full time, I do not devote much attention to the stock market during the day. Usually that's not so much of a problem because I don't daytrade so there is no need for me to focus on my positions every minute of the trading day. However, every once in a while, an easy lay-up will arise and I just won't be able to react in time. Case in point, DJ screwed up today in reporting ACSEF's earnings:
It would have been great if that were true, but in fact, ACSEF only earned 9 cents a share. Within a minute, DJ corrected the story but by then, enough traders had been suckered in to send the stock up 18 percent. Unfortunately, by the time I noticed the Scottrade news alert in my inbox, the dust had settled and ACSEF was already down 10 percent for the day (a 28 percentage point swing in a few minutes!). Oh well.
News for 'ACSEF' - (*DJ ACS Motion Control 3Q EPS 44c Vs 21c>ACSEF)
(MORE TO FOLLOW) Dow Jones Newswires
October 25, 2006 14:32 ET (18:32 GMT)
Copyright (c) 2006 Dow Jones & Company, Inc.- - 02 32 PM EDT 10-25-06
Source: DJ Broad Tape
Compliments of Scottrade.com
It would have been great if that were true, but in fact, ACSEF only earned 9 cents a share. Within a minute, DJ corrected the story but by then, enough traders had been suckered in to send the stock up 18 percent. Unfortunately, by the time I noticed the Scottrade news alert in my inbox, the dust had settled and ACSEF was already down 10 percent for the day (a 28 percentage point swing in a few minutes!). Oh well.
Monday, October 23, 2006
Buy and hold?
The week was off to a rocky start with my portfolio losing 0.2 percent today.
Back in May of last year, I entered all my positions at Openportfolios.com, a site that allows users to create model portfolios that are viewable by the public. I haven't touched that portfolio since because I wanted to see what would happen to it if I didn't adjust any of the positions. Here's where things would stand (click to enlarge):
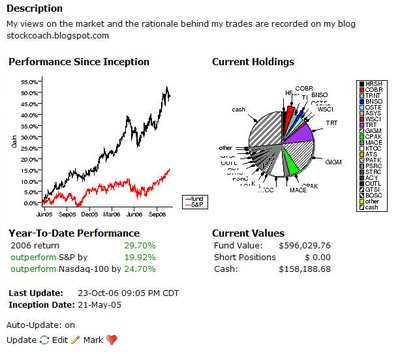
Looking only at 2006, if I still had exactly the same portfolio now that I had in May 2005, my return would have been 29.7 percent so far this year, virtually identical to what I actually earned. In fact, the passive portfolio would have won out because by now, all those gains would be long-term and so I would have a lower accrued tax liability (not to mention that I wouldn't have needed to spend all that time actively managing my portfolio).
However, things aren't so simple. Just by looking at the pie chart, I can see that much of this year's gain would have come from one stock: GIGM. GIGM is one of those stocks that I obviously sold way too soon, a stock that will forever sit in my pantheon of "I kick myself whenever I see how high the price is now" stocks like SINA, SOHU, and JCOM. Also, active management certainly did help things between May and December 2005, when my actual portfolio gained about 47 percent compared to the passive portfolio, which gained only 15 percent (although that 15 percent may be too low because I am not sure how Openportfolios handled OUTL and PSRC, two stocks that got bought and are no longer publicly traded).
At any rate, taking a long-term approach, I don't think there is any way that I could have chosen a portfolio that would have gained over 1400 percent since November 2000. So, on balance, I think active management for me is the preferred strategy over a simple buy and hold approach. However, it is clear that in order to profit from such stocks as GIGM, I really do need to let my winners run more.
Back in May of last year, I entered all my positions at Openportfolios.com, a site that allows users to create model portfolios that are viewable by the public. I haven't touched that portfolio since because I wanted to see what would happen to it if I didn't adjust any of the positions. Here's where things would stand (click to enlarge):
Looking only at 2006, if I still had exactly the same portfolio now that I had in May 2005, my return would have been 29.7 percent so far this year, virtually identical to what I actually earned. In fact, the passive portfolio would have won out because by now, all those gains would be long-term and so I would have a lower accrued tax liability (not to mention that I wouldn't have needed to spend all that time actively managing my portfolio).
However, things aren't so simple. Just by looking at the pie chart, I can see that much of this year's gain would have come from one stock: GIGM. GIGM is one of those stocks that I obviously sold way too soon, a stock that will forever sit in my pantheon of "I kick myself whenever I see how high the price is now" stocks like SINA, SOHU, and JCOM. Also, active management certainly did help things between May and December 2005, when my actual portfolio gained about 47 percent compared to the passive portfolio, which gained only 15 percent (although that 15 percent may be too low because I am not sure how Openportfolios handled OUTL and PSRC, two stocks that got bought and are no longer publicly traded).
At any rate, taking a long-term approach, I don't think there is any way that I could have chosen a portfolio that would have gained over 1400 percent since November 2000. So, on balance, I think active management for me is the preferred strategy over a simple buy and hold approach. However, it is clear that in order to profit from such stocks as GIGM, I really do need to let my winners run more.
Friday, October 20, 2006
Weekly Summary: 4 out of 5 ain't bad
Although my portfolio wasn't quite able to stay in the plus column today, on the whole, this was a solid week, with my portfolio making gains four out of the five trading days. In total, the portfolio gained $12,993 (1.7 percent) to a new all time high of $784,079. And even better, I handily outperformed the indices this week, which is the first time I've been able to achieve that in quite a while. I guess I always measure my performance in relative terms. As perverse as it sounds, I think I feel better if my portfolio falls one percent while the rest of the market dives 3 percent than if my portfolio gains only one percent while the rest of the market gains 3 percent. Perhaps that's a strange way of looking at things, but I suspect many people who manage their own portfolios feel the same way.
I see that Pine Valley declared bankruptcy after the close. It's one of the few stocks that I've ever ridden down to zero, and given that the stock was initially 1.5 percent of my portfolio, it's also going to be the biggest dollar loss that I've ever incurred. The only positive thing I can say is that I never doubled down on this stock. It was also one of the few stocks that I bought after hearing about it on the news as opposed to finding it through one of the stock screens that I run. So I guess this serves me right for deviating from an approach that has worked so well in the past.
I see that Pine Valley declared bankruptcy after the close. It's one of the few stocks that I've ever ridden down to zero, and given that the stock was initially 1.5 percent of my portfolio, it's also going to be the biggest dollar loss that I've ever incurred. The only positive thing I can say is that I never doubled down on this stock. It was also one of the few stocks that I bought after hearing about it on the news as opposed to finding it through one of the stock screens that I run. So I guess this serves me right for deviating from an approach that has worked so well in the past.
Thursday, October 19, 2006
Oopsiedoopsie on EBAY
Okay, so I shorted EBAY this morning in the pre-market. I thought the stock would sell off just like YHOO did a day earlier after announcing lukewarm results. I was wrong. Well, that's $400 I won't see again. Anyway, aside from that little faux pas, the rest of the portfolio did well, with gains in TSTC, VTEK, and NYER propelling it to a 0.7 percent gain and another all-time high.
Wednesday, October 18, 2006
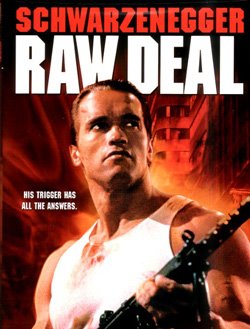
Raw Deal for Vodavi Shareholders
The portfolio continues to march ahead, gaining 0.1 percent yesterday and another 0.3 percent today. Most of today's gain was due to Vodavi (VTEK), which popped up 8 percent in the last 30 minutes of trading. Then, shortly after the market closed, Vodavi announced that they will be acquired by Vertical Communications. Both Vodavi and Vertical surged in the last half hour of trading on high volume, in Vertical's case by 40 percent. It appears that someone got wind of the transaction before the press release was disseminated to the public. If that's the case, then someone broke the law and should go to jail.
Aside from the apparent insider trading, there is the matter of the deal itself. Vertical Communications is an unprofitable BB stock. What's more, Vodavi never bothered to announce to the public that it was interested in being acquired nor, as far as I can tell, to hire an investment bank to market the company. All we got is a "fair value" assessment, which in my opinion, is worth little more than the paper it is written on. Given how much money there is in private equity these days, I think if Vodavi had actively marketed itself, it could have gotten $10 per share for shareholders. That's my fair value assessment.
How will this play out? On the positive side, this is an all cash transaction and Vertical has already lined up the financing for the deal, so it's highly likely that Vodavi shareholders will get at least $7.50 per share. Hopefully, however, now that the deal has become public, a competitor or private equity fund will step in and offer a sweeter offer to shareholders. I wouldn't hold my breath on this, but I do think there is a reasonable probability (maybe 25 percent) that it will happen.
Monday, October 16, 2006
Do yourself a favor, and visit CXO Advisory
Up 0.6 percent today. One of the things that I find amazing is how many people there are who are obsessed with the stock market but have never bothered to read any of the thousands of research papers about the stock market. It's like to trying to become a surgeon without every bothering to go to medicine school. Some might argue that the academic literature is irrelevant. But that's a rather strange judgement considering that those people who make it typically don't know the literature and so can't be in position to say one way or another. So let me bring things down to earth and ask a few questions that have been extensively probed in various academic papers. I think you will agree that regardless of whether you are technician or a fundamentalist like myself, knowing the answers to these questions can improve your trading performance.
Do stocks that have been winners over the past few months continue to outperform?
Do stocks that have been winners over the past 3 years continue to outperform?
If a stock outperforms the market but does so on low volume, it is more likely to keep going up than if it outperformed on high volume?
Do fund managers that invest in small cap growth stocks outperform the market? What about fund managers that invest in value stocks?
Do stocks with high short interest outperform the market?
Do stocks with falling institutional ownership outperform the market?
Is the reaction of the market to positive economic news (i.e. lower unemployment) different in bear markets than bull markets?
How much of the outperformance of small caps is subsumed by the value premium?
During which months do momentum stocks do best?
During which months do small cap stocks do best?
Are momentum effects more pronounced for small cap or large cap stocks?
How is consumer sentiment correlated with stock returns?
Do companies that have recently announced a secondary offering outperform?
Do companies with lots of insider selling underperform?
Do companies with strong analyst ratings outperform?
Do companies that have been recently upgraded by analysts outperform?
Do companies with a high dispersion of analyst earnings estimates outperform?
Do stocks that have recently hit a 52 week high outperform?
Do stocks that have recently experienced above average volume outperform?
Do stocks that have crossed upward through their 50 week moving average outperform?
Anyway, you get the picture. It took me less than 10 minutes to type those questions. I could easily type another 500. Do you know the answers? If not, you're not alone. Most Wall Street money managers don't know either. And I think if you knew the answers, many of them would surprise you. So perhaps you should spend a bit less time watching the price bounce around on a stock chart and do some research. A good place to start is CXO Advisory. They have produced executive summaries on many outstanding research papers. I also suggest you download some of these papers (most are available free of charge) and try to read them. It might be boring, but believe me it's worth it.
Anyway, you get the picture. It took me less than 10 minutes to type those questions. I could easily type another 500. Do you know the answers? If not, you're not alone. Most Wall Street money managers don't know either. And I think if you knew the answers, many of them would surprise you. So perhaps you should spend a bit less time watching the price bounce around on a stock chart and do some research. A good place to start is CXO Advisory. They have produced executive summaries on many outstanding research papers. I also suggest you download some of these papers (most are available free of charge) and try to read them. It might be boring, but believe me it's worth it.
Friday, October 13, 2006
Weekly Summary: Cash is King for now
This week was much like the last few weeks. The portfolio continued to push ahead, rising 1.8 percent to a new all time high, but in relative terms, I continued to lag the Russell 2000. One of the things contributing to the drag on my relative performance is my large cash position, which is now nearly 25 percent of my portfolio. On top of that, I have some stocks (CNSI and OLGR) that are being bought out and hence aren’t moving. Although this is making it difficult to outperform in a rising market, I am satisfied with my portfolio allocation. My long-term thesis is that this is a sideways market and given the run up in the indices over the past few months, I think we may be close to the top of the trading range. Although I have been nibbling on a few stocks (buying a bit more VTEK, PEAK, and starting a new position in PTG), on the whole I am not finding a lot of “value” out there, so I prefer to maintain a large war chest in case the market corrects and more bargains appear.
So I see MNCS.OB fell another 50 percent today (I guess not too many people read the Vancouver Sun article when this stock was still over $8?). Though it’s hard not to gloat, I must confess I got suckered into the same sort of stuff when I first started investing in 1998. I would tell you the names of the companies but almost all of them were BB stocks and every single one of them has disappeared from the face of the earth. Fortunately, being a college student, I didn’t have much money back then, but it still really hurt (in total, I think I lost about $10,000 during my first foray into the market, this during the biggest bull market in history). Luckily, I didn’t give up. I picked up the pieces and started putting money back into the market in late 2000 (good timing, eh?), but this time I was able to avoid many of the traps that novice investors fall into. And so far so good.
So I see MNCS.OB fell another 50 percent today (I guess not too many people read the Vancouver Sun article when this stock was still over $8?). Though it’s hard not to gloat, I must confess I got suckered into the same sort of stuff when I first started investing in 1998. I would tell you the names of the companies but almost all of them were BB stocks and every single one of them has disappeared from the face of the earth. Fortunately, being a college student, I didn’t have much money back then, but it still really hurt (in total, I think I lost about $10,000 during my first foray into the market, this during the biggest bull market in history). Luckily, I didn’t give up. I picked up the pieces and started putting money back into the market in late 2000 (good timing, eh?), but this time I was able to avoid many of the traps that novice investors fall into. And so far so good.
Thursday, October 12, 2006
Puttering along
Just like last week, the portfolio continues to putter along (gaining 1.1 percent so far this week), but in terms of relative performance, I continue to badly trail the NASDAQ and my comparator benchmark, the Russell 2000.
I couldn't help but laugh when I saw MNCS.OB this morning. So much for that amazing stock that doesn't go down. The company's press release was particularly entertaining: "we are not aware of any materially adverse news". Well, here's a possible explanation: up until a few days ago, your company was a quarter billion dollar shell.
I couldn't help but laugh when I saw MNCS.OB this morning. So much for that amazing stock that doesn't go down. The company's press release was particularly entertaining: "we are not aware of any materially adverse news". Well, here's a possible explanation: up until a few days ago, your company was a quarter billion dollar shell.
Monday, October 09, 2006
PTG
Down 0.1 percent today. I started a new position in PTG. The company has lots of cash and a big buyback underway. Given the growth in its software business, I think PTG can earn $1 million this year, which would give it a price to enterprise value of about 4, definitely an attractive multiple in a market where smallcap value stocks have become scarce. I'm in for 1500 shares and will consider buying additional shares if the price comes down more.
Friday, October 06, 2006
Weekly Summary: Sideways
It was an excellent week for the markets, with the Russell 2000 leading the way with a 2 percent gain. My portfolio, however, lagged far behind, and gained only 0.2 percent. A profit is a profit, but obviously it's disappointing when I underperform by that magntitude.
And now for my first ever "dubious stock of the week" award. This week the prize goes to MNCS.OB. No revenues, virtually no assets, but the company does sport a $250 million market cap and a stock chart that, to put it diplomatically, raises a few eye brows. Somehow I feel that there will come a time in the not so distant future when the exit door for this stock will seem mighty narrow. "Hey I thought you were the Greater Fool?". "What, I thought you were the Greater Fool!". "Oh, oh"
And now for my first ever "dubious stock of the week" award. This week the prize goes to MNCS.OB. No revenues, virtually no assets, but the company does sport a $250 million market cap and a stock chart that, to put it diplomatically, raises a few eye brows. Somehow I feel that there will come a time in the not so distant future when the exit door for this stock will seem mighty narrow. "Hey I thought you were the Greater Fool?". "What, I thought you were the Greater Fool!". "Oh, oh"
Wednesday, October 04, 2006
Doh
To quote Homer Simpson, I've been busier than a Japanese beaver the past few days, so I haven't had time to think much about the market. Basically, I've been checking my portfolio at the end of each trading day, but that's about it. And so far my performance this week has not been good. Down 0.9 percent Monday, down 0.1 percent yesterday, and up only 0.4 percent today, on one of the biggest days for the market this year.
I don't have all the data, but it seems like microcaps have barely partipated in the big rally over the past few days. I have several watch lists that I track with Yahoo! finance and they are showing a lot more red than they normally would on a day like today. Perhaps this just reflects the normal lead-lag relationship between smallcaps and large caps, or perhaps this really is the continuation of a trend of largecap outperformance that we've been seeing for the past few months. Hard to say. At any rate, I intend keep following my trading plan and see what ensues.
A number of you have asked me about the RSS feed for this blog. I don't really know what an RSS feed is but apparently I have one at http://stockcoach.blogspot.com/atom.xml
![]()